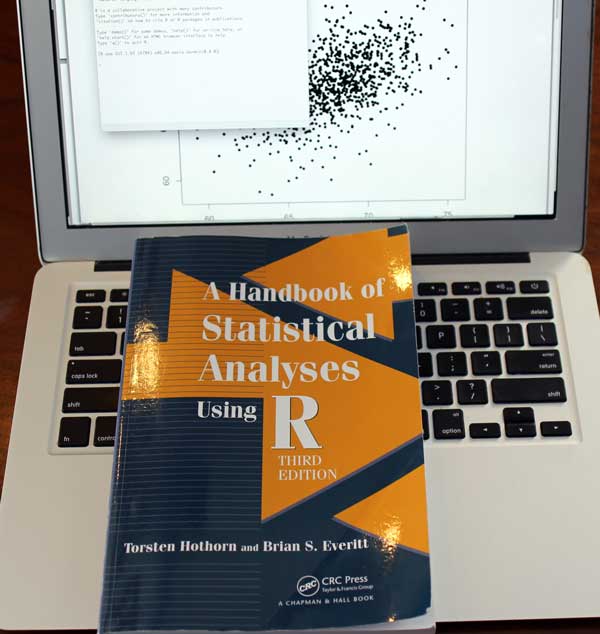
With the explosion of the amount of data available, the need for stronger data analysis tools than Excel has grown. Fortunately one of the best data analysis tools, R, is also free. This book, A Handbook of Statistical Analyses using R, Third Edition, by Torsten Hothorn and Brian Everitt, provides a handy primer for using R to perform standard statistical data analysis.
As suggested by the title, the book is not meant to teach you data analysis. Rather, it is a *handbook* of methods of data analysis using R. After an introductory chapter for those completely unfamiliar with R, each chapter focuses on applying a specific statistical technique to data using R.
Each chapter has a similar structure, and the teaching method uses a data-first approach. The Analysis of Variance chapter, for example, begins with a sample dataset and a short case study to give context. A brief summary of the analysis of variance statistical technique is given, followed by the commands for how to perform analysis of variance in R using the case study data. For each R command, expected outputs are given so that you can verify what you are doing if you are following along on your own computer. A summary of the analysis findings are given (i.e., how to interpret the data), along with final comments. End of chapter exercises are also given so the reader can explore further.
The list of chapter titles are:
1 An Introduction to R
2 Data Analysis Using Graphical Displays
3 Simple Inference
4 Conditional Inference
5 Analysis of Variance
6 Simple and Multiple Linear Regression
7 Logistic Regression and Generalized Linear Models
8 Density Estimation
9 Recursive Partitioning
10 Scatterplot Smoothers and Additive Models
11 Survival Analysis
12 Quantile Regression
13 Analyzing Longitudinal Data I
14 Analyzing Longitudinal Data II
15 Simultaneous Inference and Multiple Comparisons
16 Missing Values
17 Meta-Analysis
18 Bayesian Inference
19 Principle Component Analysis
20 Multidimensional Scaling
21 Cluster Analysis
Note that every example, graphic, dataset, and output in the book can be reproduced using a free R package the user can download.
Who’s this book for? It’s not meant to teach you statistics, so it’s best if you are already familiar with statistical data analysis approaches. You don’t have to be an expert though—the short theory section for each statistical method covered in the book gives you the main points, and you can learn main concepts by working through the case study and seeing the R commands used in the context of the given case study problem. Note however that there is a lot more to R than is covered in this book, so don’t expect this to be a comprehensive book on how to use R.
So, students, analysts, professors, and scientists: if you are looking to add R to your toolkit for analyzing data statistically, then this book will get you there.
Available here: A Handbook of Statistical Analyses using R, Third Edition, by Torsten Hothorn and Brian Everitt.

